Live Chat


The hard part of a literature review is not finding sources or writing prose. It is the step in between: turning forty papers into an argument. Most guides skip it, listing the stages and leaving synthesis as something you are supposed to manage on instinct.
You are not imagining the difficulty. A study of 40 completed master's theses, plus interviews with ten postgraduate students, found that most students, including the proficient ones, summarized what each researcher had found instead of synthesizing across them (Shahsavar and Kourepaz, 2020, in Cogent Education). Both authors are based in Iran; read the finding as a description of the skill, not of one country's students.
What follows is a method for that step, built around a matrix you can put together in an afternoon. If you would rather see finished reviews taken apart first, start with our literature review examples.
- Set your boundaries in writing before searching, and save the search terms.
- Build a synthesis matrix: sources down one axis, themes across. It converts reading into structure.
- A column earns its place only if it holds two to four values, at least one of them shared by more than one source. A single value throughout is your scope; a different value in every cell is a list.
- Most "the studies disagree" paragraphs are not empirical conflicts — they differ by construct, instrument, population or period, and the grid shows which.
- Expect to redraw the columns once, two-thirds through the reading. That is the method working.
Set the boundary before you search
An undefined search never ends, because there is always one more paper. Write the limits down first:
- Date range, and the reason for it. "Since 2015" is arbitrary; "since the 2015 policy change" is a boundary.
- Population or setting — higher education only, US only, adults only.
- Method types you will include, if the field splits that way.
- Language and publication type — peer-reviewed only, or gray literature too.
These go into the review itself later, so the writing is not wasted. A reader has to know what you excluded to judge what you found.
Save the searches as you run them: database, exact terms, filters, date, number of hits. It buys you a scope paragraph you do not have to reconstruct from memory, and the ability to rerun everything in half an hour once your chapter has aged six months.
Search in three layers, and know when to stop
Three passes, each catching what the last missed.
Your field's main databases with structured search terms. Record the terms and the date; rerunning a search you cannot reconstruct is miserable.
Mine the reference lists of your three most relevant papers. This finds the foundational work keyword searches skip, because its vocabulary is older.
Find what has cited those same three since. This finds the current conversation, which is where your gap usually lives.
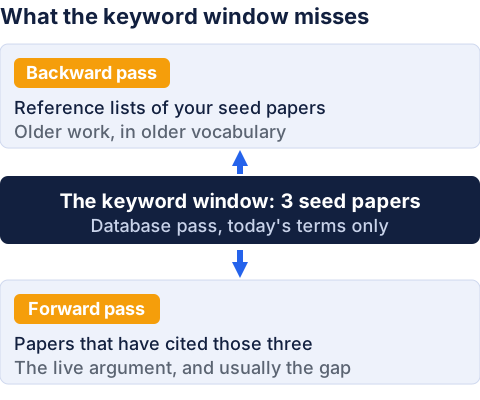
The stopping rule is the part nobody gives you. Reading does not end when you have covered the field — you cannot know that from the inside. It ends when new papers stop changing your matrix: five consecutive sources that add no new value to any column, and no new column. Past that you are collecting confirmations.
Vague columns saturate almost immediately, and it will feel like you have finished when you have barely started. If you hit five flat sources in your first week, the columns are the problem, not the field.
The arithmetic that leaves no room for a source-by-source review
Before the method, the reason for it. Divide the word count of your literature review by your source count.
| Where the review sits | Rough length | Sources | Words per source |
|---|---|---|---|
| Undergraduate capstone review | 2,500 | 15 | ~165 |
| Master's thesis chapter | 6,000 | 30 | ~200 |
| Doctoral dissertation chapter | 12,000 | 70 | ~170 |
Two things fall out of that. The budget per source is about one paragraph at every level, because source counts grow along with chapter length — a longer chapter buys no more room per study. And that one paragraph still has to carry the sentences connecting studies, the ones holding two of them in a single clause, which in a source-by-source plan get no allowance at all.
Grouping sources is therefore not a stylistic preference your advisor happens to hold. It is the only arrangement that leaves room for the connecting sentences. Put your own numbers in; the conclusion does not change.
Build the synthesis matrix
This is the step that does the work. A spreadsheet: sources as rows, themes as columns.
| Source | Defines engagement as | Measured by | Setting | Direction of finding | Limitation |
|---|---|---|---|---|---|
| Smith 2019 | Behavioral | Log data | US, higher ed | Decline | One site |
| Jones 2021 | Behavioral | Self-report | UK, higher ed | Decline | Self-report |
| Patel 2022 | Affective | Survey | US, higher ed | No change | Construct |
| Nwosu 2023 | Behavioral | Log data | Nigeria, higher ed | Decline | Small n |
Smith, Jones, Patel and Nwosu are placeholder studies written for this article, not real work. The topic — student engagement under remote delivery — is realistic, and the cell values are the kind you would actually record.
Four rows and the argument is already visible. Three studies agree and one does not, and the one that does not differs in two columns at once — it defines engagement differently and measures it differently. That is a paragraph, and you have not written a word of prose yet.
Notice how short the cells are. A cell holds a word or two, eight at the outside, never a sentence — values you can compare at a glance are what make patterns visible, and long cells turn the grid back into notes.
Which columns earn their place
Every guide tells you to put themes across the top; none tells you which themes. This is the test that decides it: look down a column, count how many different values it holds, and check whether any of them repeats.
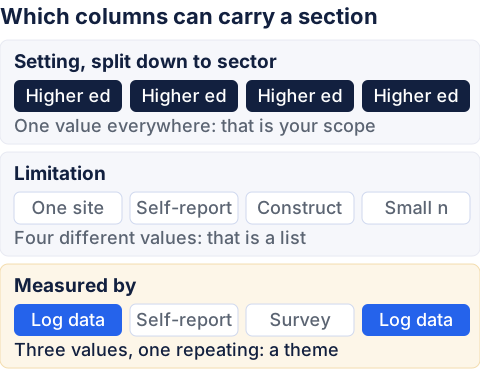
One value everywhere is your scope, not a theme. Split the Setting column and it comes apart into two things. Country varies — US, UK, Nigeria. Sector does not: every study is higher education. That half belongs in your boundary paragraph and, later, your limitations. There is nothing in it to compare, though the absence itself belongs in your conclusion.
A different value in every cell is a list, not a theme. The Limitation column holds four unrelated values, none of them shared by any two sources. They are useful notes, but a section built on them would be four paragraphs about four papers — the exact shape you are trying to escape.
Two to four values, at least one of them shared by more than one source, is a theme. Measured by holds three values, and log data is shared by two sources, which is enough to put a finding to the test: either it holds across the values, which makes it robust, or it splits by them, which makes the column itself the story. Both outcomes are a section.
A column that fails the test is often a good column written badly. "Finding" as free text is a list; recode it to a direction — decline, no change, increase — and the same information becomes a theme. Run that pass two-thirds through the reading. Redrawing columns then is not backtracking; it is the moment the field's structure becomes visible.
Read the matrix three ways
Across a row you get one source — the reading you already know how to do, and the least useful here, because a row produces nothing but a paragraph about that paper. Down a column you get a theme, and every cluster of matching values is a claim with its evidence attached. That is where sentences come from.
Across the grid you get what nobody has done. Three shapes of emptiness are worth hunting for:
- An empty column. You expected the field to address something and it does not. The strongest gap type, and the one most likely to be a search failure — rerun the chaining passes before claiming it.
- A column with one value in every cell. Nobody has looked anywhere else. Here, no study sits outside higher education.
- Two columns that never cross. A value in one column never shares a row with a value in another. The affective definition appears only alongside a survey, never with log data — so nothing here separates the construct from the instrument, and Patel's result has two explanations with no way to choose between them. Usually the most defensible gap for a student project, because closing it is a piece of work rather than a career.
When two studies disagree, find out why first
Students write "the findings are mixed" and move on. The matrix lets you do better, because you can see which columns differ between two studies and which do not.
| What differs | What it means | What you write |
|---|---|---|
| The construct — the definition column | They are not measuring the same thing | Name the disagreement as definitional, then say which construct you adopt and why |
| The instrument, same construct | Possible measurement artifact | Nobody has tested both instruments in one sample — often a gap in itself |
| The population or setting | A boundary condition, not a contradiction | Say where the finding does and does not travel |
| The period, plus something datable between | The world changed, or the method did | Say which, and give the change a name rather than a decade |
| Nothing you can identify | A genuine empirical conflict | Rare. Give it a paragraph and say plainly that the field has not resolved it |
The last row is the one worth remembering. Most disagreements students report as conflicting evidence are one of the first four, and naming which separates a literature review that reports the field from one that explains it.
Turn columns into sections
Your columns become your section headings — but not one for one, which is where the mapping usually goes wrong.
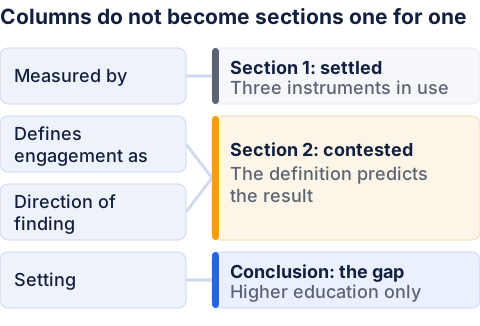
- A multi-value column whose findings converge becomes the early settled section. Measured by holds three instruments, and the decline turns up under two different ones, so it is not an artifact of any single method. Settling that first makes the contested section land harder.
- Two columns that move together become one section. Here the definition predicts the direction of the finding, so they are one argument.
- A contested column becomes your longest section. Disagreement is your strongest material; give it room.
- A single-value column — Setting, once you reduce it to sector — is not a section. It is your scope paragraph — and when that single value means the field never looked anywhere else, the same fact becomes the gap in your conclusion. Setting does both jobs here.
- An empty column or an uncrossed pair is not a section either. It goes in the conclusion, as the gap.
Order them settled first, contested second, gap last. A reader has to accept the common ground before a disagreement about it means anything.
Draft from cells, not from notes
Each paragraph opens with the claim and brings sources in as support. Every clause has a coordinate in the grid, which is why drafting from a stable matrix is fast.
Claim — a column header plus its dominant value: "Where engagement is defined behaviorally, remote delivery is associated with a decline."
Evidence — the rows that share it: "(Smith, 2019; Jones, 2021; Nwosu, 2023)."
Tension — the row that differs, plus the columns that could explain it: "Patel (2022) reports no change, but defines engagement affectively and is the only study to use a survey, so the disagreement sits in the design rather than in the results."
Forward — the consequence for your own work: "Separating the construct from the instrument is therefore the first methodological decision any new study has to defend, including this one."
The grid also hands you a move most drafts miss. Smith and Nwosu used log data and Jones used self-report, yet all three found a decline — so the decline is not an artifact of one instrument. That sentence is free once the matrix is in front of you, and invisible from per-paper notes.
Repeat the four moves across the chapter and the review synthesizes by construction rather than by effort.
Where the standard method strains
Three situations change the process rather than merely complicating it.
Your program requires a systematic review. Then the search is the method, not a preliminary to it: criteria set in advance, screening decisions recorded as you make them. In health and much of the social sciences, reviews report against the PRISMA 2020 statement (Page and colleagues, BMJ, 2021), whose flow diagram asks for counts at every screening stage. Those numbers are painless to log while searching and close to impossible to reconstruct afterward. The matrix survives — it becomes your data-extraction table.
The field is split across disciplines using different words for one idea. The symptom is two clusters of papers that never cite each other. Take the most cited paper from each and check its reference list for the other. If neither knows the other exists, you have two literatures, and the honest move is to say so and review both.
A paper does the thing you were going to do. Read it properly before panicking. It usually differs in population, instrument or period, and that difference is your project stated more precisely than you could state it before. If it genuinely answers your question, tell your advisor immediately: a question that changes in month two is routine, one that changes in month eight is a crisis.
Where the process breaks, and how long it should take
These are failures in the work, not in the chapter. Each has one cause and one repair.
| What you notice | What is actually happening | The repair |
|---|---|---|
| You keep reading and the pile keeps growing | You have no stopping rule | Apply the five-flat-sources rule, after checking the columns are sharp enough for it to mean anything |
| Your notes are long and you cannot use them | You took notes per source, in prose | Recode into cells of a word or two, eight at the outside; the prose stays as backup |
| The columns will not stay still | They are free-text questions, so every source answers differently | Run the column test and recode the failures |
| Drafting is slow and directionless | You started writing before the matrix stabilized | Finish the grid first; four stable columns draft faster than forty pages of notes |
| You cannot find a gap anywhere | Most often, you are looking at rows | Look at columns, then at the combinations that never occur — and read the limitations paragraphs of your most-cited sources, where authors name gaps outright |
If your search genuinely finds your question has been answered, say so and adjust the question. A gap manufactured to justify a project is visible to any committee member who knows the field, and it undermines everything after it.
On timing: plan the reading, not the writing. For a master's literature review of 25 to 40 sources, reading and matrix-building typically take two to three times as long as the prose — and that ratio is the thing to protect when a deadline compresses. Buying drafting time out of reading time is the wrong trade, because a shaky grid makes every drafting hour slower.
Six questions to ask your own chapter
Each maps back to a step above, and each no points at a specific piece of work.
- Is your scope a paragraph in the chapter, not just a decision you remember making?
- Can you rerun every search from what you wrote down at the time?
- Does every column hold two to four values, at least one of them shared by more than one source? A single-value column moves to your scope, your limitations, or your gap.
- Is every section heading a column value rather than an author or a date?
- Has every disagreement been triaged, so that no section says "the findings are mixed" and stops?
- Does your gap point at an empty column, one value everywhere, or a pair that never crosses? If you cannot show it in the grid, it is not yet a gap.
For the stage before this one, see our guide to finding a dissertation research topic; for the review as a short section rather than a chapter, our research paper walkthrough shows where it sits. If the synthesis has stalled, our literature review writing service builds a thematically organized chapter around your question, from $7.89 a page, within our paper writing service.