Live Chat


The number at the top of your Canvas Grades page counts only the work that has already been graded. Everything with a dash in the score column — the quiz you skipped, the paper still sitting with your instructor, the final exam in six weeks — is left out of both halves of the fraction. That is why the percentage on screen is usually higher than where you really stand, and why it can sit at 94% in week 3 of a course you are quietly falling behind in.
Canvas does calculate a second number that counts everything. Your instructor sees it in a spreadsheet column called Final Score; you get at it by clicking one checkbox in the sidebar. Neither number is your grade. This post shows you what each one is made of, works a real gradebook through both, and gets you to the third figure — the one that actually describes your position today.
- Total counts graded work only. Instructure's Student Guide: the current grade comes from "adding up the graded assignments," with the Calculate based only on graded assignments box selected — and it is selected by default.
- Uncheck it and Canvas counts everything. The total grade adds "both graded and ungraded assignments," so every dash becomes a zero, including work that is not due yet.
- Ohio State says it plainly to students: if you have not submitted something and no zero was recorded, "your Current Grade may appear higher than it actually is."
- Neither number is your standing. One gradebook below produces 84.17%, 33.11% and 77.69%. Only the third describes where the student is.
- In a weighted course the total can rise as you fall behind, because Canvas drops an assignment group with nothing graded in it and divides by what is left.
- Hidden totals are a course setting, not a glitch, and at some universities hiding them is the default.
The two numbers, and which one you are looking at
Instructure's own Canvas Student Guide defines both. The current grade "is calculated by adding up the graded assignments according to their weight in the course grading scheme. This grade is calculated with the Calculate based only on graded assignments checkbox selected in the sidebar." The total grade "is calculated by adding all the assignments according to their weight in the course grading scheme (both graded and ungraded assignments). To view the total grade, deselect the sidebar checkbox."
The switch is that one checkbox in the right-hand sidebar of your Grades page, and it starts out checked. The big percentage above it changes when you click it. Nothing else does — not your scores, not your instructor's gradebook, not what anyone else sees.
This question is hard to search because the same calculation goes by three names depending on where you are standing.
| Where you see it | Graded work only | Everything counted, blanks as zero |
|---|---|---|
| Your Grades page sidebar | The big number, box checked. Canvas calls it your current grade | The same number, box unchecked. Canvas calls it your total grade |
| Your instructor's gradebook | The Total column | No column of its own; the Total column shows it only with View Ungraded as 0 switched on |
| The gradebook CSV export | Current Score | Final Score |
| The Canvas REST API | current_score | final_score |
That third row is where the word "final" comes from, and Instructure states the distinction most clearly there. Its instructor guide to viewing ungraded work as zero notes that the exported file "displays columns for the Current and Final scores: the Current score reflects the total while ignoring unsubmitted assignments and the Final score counts unsubmitted assignments as zero."
Two things follow. First, "Final Score" has nothing to do with the end of the term — it is a live calculation available in week 2. Second, if you have already found the support document from the University of North Florida's Center for Instruction and Research Technology, it tells you the Final Score "is not visible to students and is only visible to the instructor when Grades are exported or from the Interactions Report." It is describing the instructor's gradebook, and inside that frame it is correct. Read from your seat it closes a door that is standing open.
Why the default number reads high
A blank cell in Canvas is not a zero. It is not anything. The Universities of Wisconsin Digital Learning Environment knowledge base puts the mechanism exactly: when a student looks at their grade, "the blank item will not be included in the calculation, and the assignment counts neither for nor against their score appearing as if it has been Excused. This means that if the blank item is meant to be a 0, the Student will see an artificially inflated grade."
Ohio State says the same thing to its own students. Its Teaching and Learning Resource Center page "View Grades as a Student" tells students Carmen displays "your Current Grade, which includes your calculated total based only on graded assignments. Ungraded assignments are ignored in this calculation," then flags the consequence in a caution box: "If you have not submitted an assignment, and your instructor has not recorded a zero for the missing assignment, the grade will not reflect this and your Current Grade may appear higher than it actually is."
The inflation is invisible rather than obvious. A missed assignment does not show up as a bad score dragging your average down. It shows up as nothing at all, in a row you have to scroll past to notice, and your Total does not move by so much as a decimal. The bigger the thing you skipped, the wider the gap it opens between the number on screen and the truth. In the example below the blank is a 20-point discussion and the honest figure is 77.69%; make that same blank a 100-point essay and the honest figure is 59.41%. Canvas reads 84.17% either way.
Whether a zero ever gets entered is your instructor's call, and the tool for it is optional. Canvas offers a Missing Submission policy that fills blanks automatically: the percentage an instructor sets "is multiplied by the total points possible on the assignment," so a 0% setting writes zeros across the course. But it has to be switched on, it is "not automatically applied to No Submission, On Paper, or External Tool assignments" other than New Quizzes, and Instructure advises setting it up when a course is created because applying it later "does not affect previously graded missing submissions." Plenty of courses never turn it on.
One gradebook, three numbers
Here is a points-based course at week 9 of 15: five graded items, one discussion missed outright, one essay turned in and waiting, two things not due yet.
| Item | Points possible | Your score | Status |
|---|---|---|---|
| Discussion 1 | 20 | 18 | Graded |
| Discussion 2 | 20 | 17 | Graded |
| Quiz 1 | 50 | 44 | Graded |
| Quiz 2 | 50 | 41 | Graded |
| Essay 1 | 100 | 82 | Graded |
| Discussion 3 | 20 | — | Past due, never submitted |
| Essay 2 | 100 | — | Submitted, awaiting a grade |
| Quiz 3 | 50 | — | Due week 12 |
| Final exam | 200 | — | Due week 15 |
Graded points earned: 18 + 17 + 44 + 41 + 82 = 202. Graded points possible: 20 + 20 + 50 + 50 + 100 = 240. Points in the whole course: 610.
What Canvas shows you by default is 202 ÷ 240 = 84.17%. Every dash is outside the fraction, so the missed discussion, the pending essay and the final exam are all equally absent.
What you get by unchecking the box is 202 ÷ 610 = 33.11%. That is not a prediction either. It is the answer to "what if I never turn in another thing," which is true of almost nobody in week 9.
Where you actually stand is the third calculation, and Canvas will not show it to you. Count the work that has been settled: the five graded items, plus the discussion you missed, which is a real zero on 20 real points. Leave out Essay 2, because you have not earned a score on it yet, and leave out the two items that are not due. That gives 202 ÷ 260 = 77.69%.
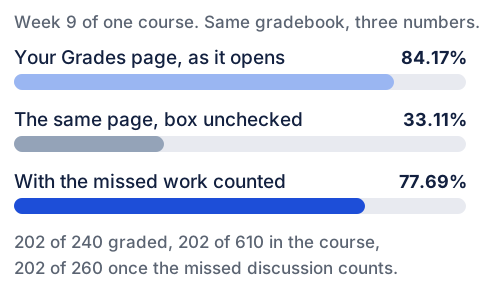
The gap that matters is the 6.5 percentage points between 84.17% and 77.69%, produced by a single blank cell on a small assignment. If your course runs the common scheme where a B floor sits at 83 and a C+ floor at 77, the number on screen says B and the settled arithmetic says C+. Your course's grading scheme is set per course, so check yours rather than assuming that one.
Essay 2 is the interesting unknown, and Canvas gives you a way to test it. What-If scores let you type a hypothetical figure into any score cell; Instructure describes them as simulating "updates to your current and final grades," and a Revert to Actual Score button puts everything back. Type 82 into Essay 2 and you are at 284 ÷ 360 = 78.89%. Type 60 and you are at 262 ÷ 360 = 72.78%. That spread — six points riding on one paper — is far more useful than either number Canvas displays on its own.
Weighted courses: the total can rise while you fall behind
If your syllabus says something like "homework 20%, projects 50%, final exam 30%," your course uses weighted assignment groups, and one extra behavior changes what the Total means.
Instructure's guide to weighting the final course grade works its own example with three groups it calls A, B and C, weighted 20%, 50% and 30%. With scores of 75%, 98% and 87%, "the final score would be calculated as (.75 x .20) + (.98 x .50) + (.87 x .30) = .901, or 90.1%."
Then comes the sentence nobody puts in front of students: "The final score calculation is changed if there are no graded items in an assignment group. In this case, all assignment groups with graded items will be divided by their combined weight, and the assignment groups without graded items are removed from the equation." With group C empty, Instructure's own arithmetic gives "[(.75 x .20) + (.98 x .50)] ÷ .70 = .9143, or 91.43%."
Read that twice. Before the exam is graded, Canvas is not showing 90.1% with a caveat. It is showing 91.43% — a higher number, because the 30% slice you have not faced yet was deleted from the denominator and the remaining 70% stretched to fill it. Now suppose group C is the final exam and it comes back at 60%. The full calculation returns: (.75 × .20) + (.98 × .50) + (.60 × .30) = .15 + .49 + .18 = 82.00%.
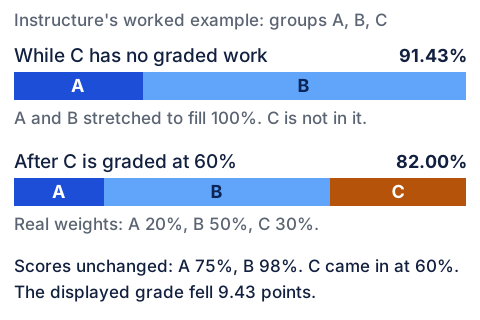
Nothing went wrong there. No zero was missed, no policy was skipped, and both graded groups held their scores exactly. The displayed number moved 9.43 points because the arithmetic behind it changed shape. In a course where a heavily weighted exam sits at the end, the Total is a running score on the work so far, not a forecast of anything, and in a course built that way it moves most at the end.
Why your total might be hidden altogether
Some students open Grades and find individual scores but no percentage at the top. That is a course setting, not a fault. Instructure's guide to hiding totals confirms that "In Course Settings, instructors have the option to hide total grades from students," and that when they do, "an informational message indicates that the calculation of totals has been disabled. Assignment group names are displayed, but totals are hidden."
Three related behaviors each produce a different flavor of confusion:
- Weighted group totals are always hidden. The same Instructure page states that "for courses that use weighted assignment groups, the assignment group totals are always hidden from students." So in a weighted course you may see the overall percentage but not the per-group breakdown.
- Hiding can be an institutional habit. Stanford's faculty guidance on calculating final grades, updated August 14, 2026, tells instructors that "By default, the Hide totals in student grades summary option is checked under Settings > Course Details, but if you uncheck it, students will see their current course total score." That is Stanford's setting, not a universal one — but it explains why some of your courses show a total and others never do.
- Unposted grades are not in your number. Stanford's page also notes that "Student view of their final grade is based on posted grades only," while Instructure describes the instructor's Total column as a running total "including assignments with hidden grades." Your instructor can therefore be looking at a different figure from you, honestly, with no one at fault.
None of this is worth arguing about, and none of it is something to work around. It is worth asking about, which is a different move and a much better one.
Working out where you actually stand
Four steps, all of which use only what you can see from your own account. You are reading a number here, not changing one.
Points-based or weighted? Which groups, at what percentages? Are low quiz scores dropped? Is there a late penalty, which Canvas applies as an automatic deduction shown on the submission details page? The syllabus governs; the gradebook is only an attempt to implement it. Where a rubric is attached to the big assignments, that is where the points you have not earned yet are described.
This is the step that does the work. A dash means one of three different things: missed (past due, nothing submitted — a zero you have already earned), pending (submitted, waiting on your instructor), or upcoming (not due yet). Canvas treats all three identically. You should not. If you are unsure what is outstanding, a system for tracking assignments outside the gradebook is the cheapest fix.
Add the points you have earned. Add the points possible on everything graded plus everything in the missed pile. Divide. In a weighted course, do that once per group and multiply each group percentage by its weight. That figure is the honest read of your position today, and the one to bring to an instructor or advisor.
Type plausible scores into the pending and upcoming cells and watch the number move. This is the only place Canvas does forward arithmetic for you, and it answers what actually matters: what do you need on the remaining work to land where you want? Revert to Actual Score clears it afterward.
The number that eventually leaves Canvas
At the end of the term one figure gets pushed to your student information system, and it is the everything-counted calculation rather than the one you have been watching. Penn State's knowledge base article "Canvas: Viewing Final and Current Grades (Student View)", revised on July 21, 2026, describes its Total Grade as covering "all assignments, quizzes, etc., including those not yet submitted or graded as a zero," then says it outright: "This is the grade that will be provided at the end of the class to LionPATH."
Two caveats. Your instructor may enter a final grade override, which replaces the calculated figure entirely — and Instructure notes that "Students can view the overridden grade in their Grades page. However, students will not know the score has been overridden." Many instructors also finish the last stretch outside Canvas, which is exactly what Stanford's guidance anticipates when it mentions curving.
So: the gradebook is a record of what has been entered, not a verdict. If your settled arithmetic and the number on screen disagree by enough to matter, one short message settles it: "I have Discussion 3 as a missing zero and Essay 2 still ungraded. Counting the zero, I make my standing 77.69%. Does that match what you have?" That is answerable in a line, and a better use of your instructor's attention than asking why Canvas looks wrong.
If the honest number is well behind where you need it, the fix is coursework rather than arithmetic. Our Canvas coursework help works alongside a live course from $37.89 a week: we prepare the work to your rubric and deadline and hand it to you, and you review it and submit it yourself from your own account. We never ask for your login, and nothing we do touches a gradebook. New to the platform? Our guide to what Canvas LMS is covers where Grades, Modules and Assignments sit in a course.
Canvas behavior above was read on August 20, 2026 in Instructure's current documentation, which now lives at community.instructure.com since the community.canvaslms.com addresses began redirecting there. The vocabulary moves: the instructor-side control Canvas now labels "View Ungraded as 0," under the Settings icon and the View Options tab, was "Treat Ungraded as 0s" under a gear icon in older university guides that still rank on this question.